AQI with PyPortal
Our house doesn’t have A/C, nor insulation. It gets quite hot during the summer, unless we open the windows. However, it’s fire season again, and that means the air quality has been all over the place. After a week of trying to stay on top of it, and invariably not closing the windows early enough, I realized this would be a good use of my PyPortal.
I subscribed to Adafruit’s AdaBox, and received a PyPortal last year. However, I hadn’t found anything I wanted to display. There are a bunch of neat ideas, but AQI during wildfire season is the first that’s really made sense to me:
- easy to glance at
- something quantifiable that isn’t immediately observable
- information that’ll change my behavior
- something that’s changing dramatically throughout the day
Of course, I’m not the first one to think of it. It’s even one of the example projects from Adafruit: PyPortal_AirQuality. I signed up for an AirNow account, ran the sample request, and realized it was showing the forecast for tomorrow. Not what I’m looking for. Some poking around found that AirNow also has a Current Observation endpoint, so I swapped that in, and declared victory.
Until about two hours later when the wind shifted and the smoke arrived. It quickly became apparent that the AirNow data was significantly lagging, and wasn’t suitable for my purposes.
PurpleAir is my go-to location for crowd-sourced, hyper-local air quality, and I’m lucky enough to have several sensors very close to our house. So, I went looking for their API information, and found it in a google doc. Later I realized that every sensor on the map also has a “Get This Widget” popup with the pre-constructed JSON url for that sensor.
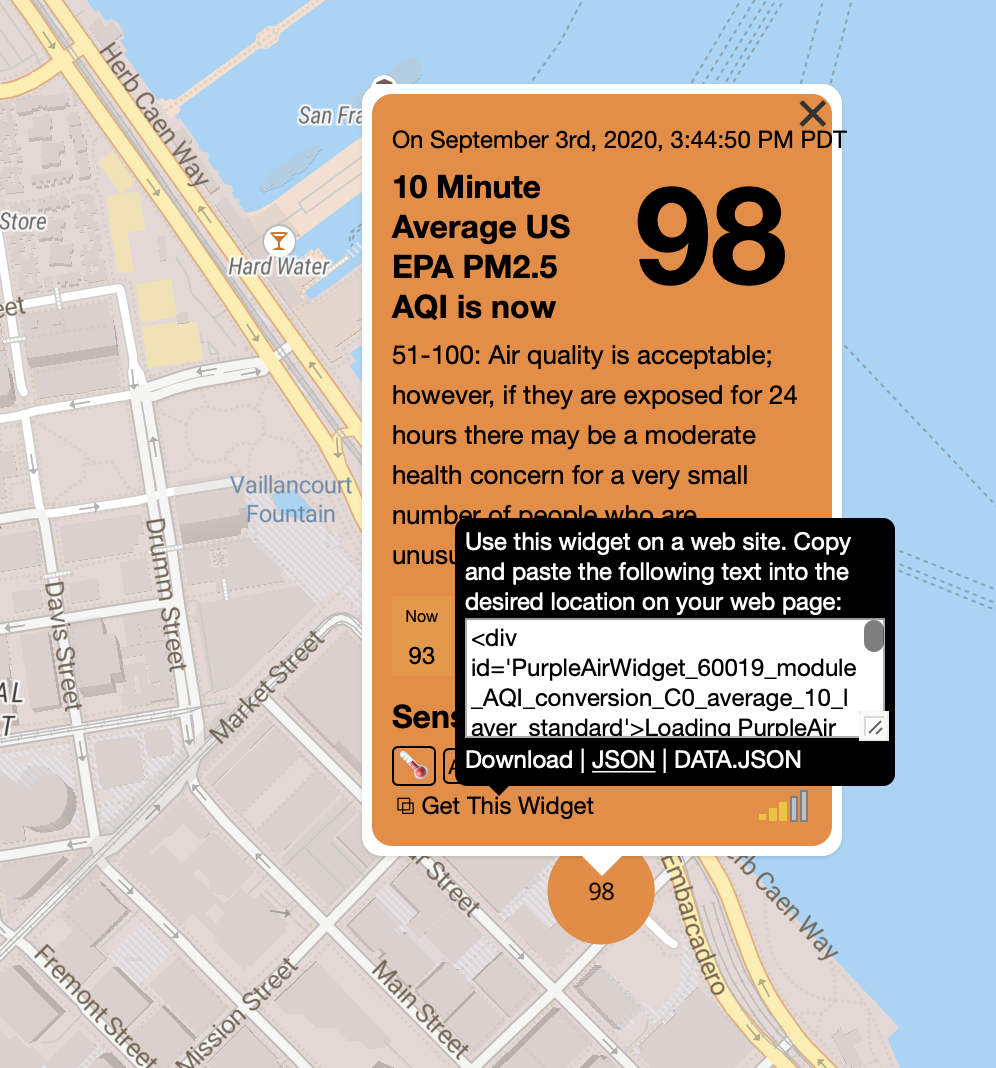
Unfortunately, the data doesn’t show the AQI value, it shows the underlying particle reading. I did the simple thing, and adapted python-aqi to calculate the AQI (verifying against PurpleAir’s calculation to make sure I was doing it correctly). With the right algorithm set up, I started averaging from multiple sensors.
It doesn’t support anything fancy, like the conversions for wildfire smoke, but I think it’s reasonable.
Project available at e28eta/pyportal-aqi
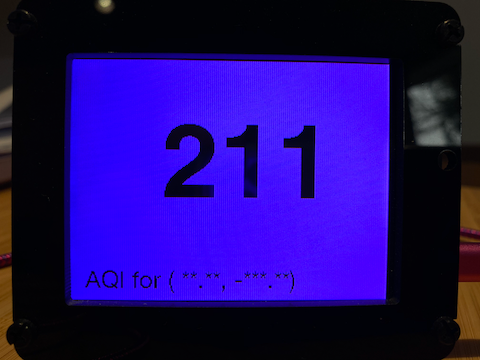
I didn’t spend very long studying the PyPortal library, but I think it’s interesting. It takes the “fetch some data & display it on screen” task, and abstracts it into a declarative process. However, the provided API breaks down in the PyPortal_AirQuality example project, and it has to be augmented with procedural code to change the background color based on the AQI.
I don’t have much experience designing APIs for beginners and non-programmers. So I don’t feel competent to judge whether this is a “good” design approach, but I was bothered by the mix that I ended up with. OTOH, this will never grow into a complicated project, and expediency is more important to me.